Panel Reflection
Indigenous disadvantage problems are indeterminate and there is no single correct solution. Some government approaches are top-down (in an attempt to reduce complexity) others are bottom-up (collaborative). Often both approaches are used simultaneously, which makes it even more complex.
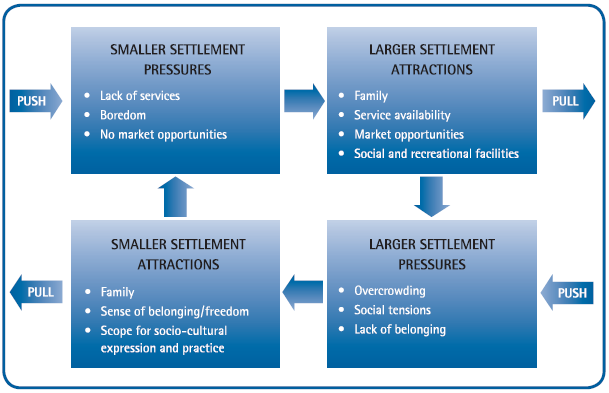
Part of the panel was about scenario modelling of indigenous disadvantage in remote areas. One model examined the effect a policy had on migration from remote areas to Alice Springs. It showed that older people tended to stay but there was a dramatic (unintended) increase in the number of younger people in Alice Springs.
Panel Question
I asked whether their modelling tools could be used for other complex issues.
They did the modelling in Excel but they were constrained by the amount and quality of the data. They were trying to identify causality between factors.
In statistics we look for association between factors, and generally leave it to other experts to work on the causality.
Tutorial Reflection
Although the tutorial was led by someone with some experience of Indigenous issues, much of the tutorial seemed to be uninformed group members sharing their views with each other. The discussion was generalised and based on assumptions and opinions.
Personal stories are a very valuable way of communicating complex issues. Dog Ear Café is a good example of this.
Connections within this course
Access to appropriate data has been raised in previous weeks, either excess data or lack of data. The idea of government departments trying to cooperate but actually acting in opposition to each other was also mentioned in Week 2.
Indigenous policy tends to be complex with many paths linking issues. These links are often not identified when policy is created. Perhaps network diagrams could be used to identify some of these connections.
Connections to other courses
Excel is not the optimum tool for analysing data. More appropriate software tools for studying causality in data include S-Plus and R.
External Connections
Dr Sarah Prout highlights the way that official government census data fails to recognise the “mobility” of Indigenous people and the adverse affect this has on the provision of government services. (Working Paper No 48/2008). This is an example of where categorisation and aggregation of statistics conceals information rather than simplifying the problem.
Tools to Manage Complexity
- Stories – Peter Radoll used stories in his presentation about his efforts to help Aboriginal people study at ANU. This brought a personal face to the complex issues involved.
- Framing – if you don’t like the question, redefine it to something that you can answer.
- understand gaps in knowledge (this was raised during the tutorial)
- statistical data analysis
